August 25, 2009
Still grappling with this… thought I’d throw some screenshots out from Eclipse MAT after analyzing my 2GB heap so you could see what I’m seeing. Mark Mandel claims this is useful but I think the CF-on-top-of-Java abstraction makes using this information incredibly difficult. Sure, I see that Transfer has 1.6GB of data locked up, but who is holding onto it?
Going through the screen shots in order:
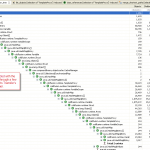
- 93% of the heap is tied up in coldfusion.runtime.TemplateProxy and its child of coldfusion.runtime.VariableScope. Not particularly surprising that there are variables out there taking up space.
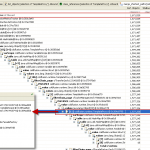
- This is the same dominator tree but expanded so you can see how the tree works. This is where I start getting lost. You can see there are a couple of hashmap entries though that are holding onto like 800mb and 500mb on their own.
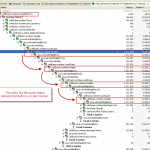
- One of the techniques I read about was to use the right-click menu and choose to look at an object by Merging Shortest Path to GC Root. The GC Root is what is preventing these objects from being collected so as long as it hangs around, so does your object. This is that view. I find it strange that the root is java.util.TimerThread followed by flex.messaging.SessionMetricsTracker. I don’t use Flex anywhere in my app? Hrmm… does this have anything to do with the server monitor perhaps? I do have it enabled in “monitoring” only… no memory or profiling. Somehow this timer is connected to the Transfer CacheManager.cfc and FacadeFactory.cfc which is holding onto 1.6GB of heap.
- Right-clicking on the template proxy and listing objects with an incoming reference gives us this image. Here is where there appears to be some kind of circular reference. You can see as you drill down that the same number of objects and heap space keeps popping up in what looks like a loop. This is the kind of thing that would prevent an object from being GC’d.
So… any ideas?


marc esher said:
on August 25, 2009 at 5:13 pm
what happens if you turn off monitoring and run your app?
Brian said:
on August 25, 2009 at 5:44 pm
No such luck… also looked at the heap dump from the other server and it had the same thing with monitoring disabled. It must be some internal thing used to hold open the Application scope (which is where Transfer exists).
What’s strange is that 90% of the time, it’s server 2 with the issue but occasionally it’ll be server 1. They are for all intents and purposes identical… one of them (server 1 actually) performs occasional scheduled tasks but otherwise they just receive a split load of users. Yet somehow it performs about half as many young GCs, the same number of FGCs (taking up 2x the time) and runs out of memory in 48 hours. Nuts…
Steve 'Cutter' Blades said:
on August 25, 2009 at 6:00 pm
I started a little debate on my blog the other day:
http://blog.cutterscrossing.com/index.cfm/2009/8/6/Scope-Usage-and-Application-Scaling
If you follow the comments, Mike (Brunt) talks about the terrible overhead of using some frameworks in conjunction with each other. I then downloaded most all of the majors (FB, MII, MG, CS, CB, Transfer, Reactor) and ran them through the most recent build of varScoper. What I found was that the ORMs have a lot of scoping issues, in comparison to the others (which have few, if any). Transfer seemed (surprisingly) to be the worst of the bunch.
BTW, Mike came in with us to do some performance tuning about a year back. At the time, we found the GC of the 1.5 JVM to work much better for our application than the 1.6. We recently went through some testing with the 1.6_14, to see if it had improved, and still found the 1.5’s GC to work better for our app.
marc esher said:
on August 25, 2009 at 6:02 pm
Is this memory “leak” causing your system to crash, or just something you’re curious about?
Great stuff, by the way. I think the “flex monitoring” class is a red herring and probably not worth investigating, as you’ve discovered. But I do wonder why the transfer cache isn’t clearing more regularly if in fact your system is running out of memory. I thought the transfer cache was built on weak references that would be kept until memory was needed, at which time GC would clean up and free memory.
You running on 64 bit with lots of heap by any chance? Here’s one of those cases where if it’s 64 bit with gigs of heap, I’d think “sweet…. it’s working exactly as it should be”.
Have you contacted Mark directly to ask him about this?
And thanks a lot for your recent posts on this subject. Excellent.
marc esher said:
on August 25, 2009 at 6:05 pm
I wonder, too, if more frequent GC would benefit your app. We recently had an issue where we were doing some bad things in code. Temporarily, we set the GC interval to 10 minutes or so, and it fixed our problems, giving us time to fix our code so that we didn’t need to monkey with GC settings.
Brian said:
on August 25, 2009 at 9:09 pm
@Steve – thank for posting that link. I read through the comments… I think what I’m struggling with that strikes me about your gut feeling is the lack of evidence. If someone could create a simple test case that didn’t involve 50,000 lines of code, Adobe would surely look at it. In reading the thread on your post, I’m not entirely sure what I should do about it, if anything?
@Marc – The leak does eventually cause the system to hang while it thrashes about with non-stop full GCs. Basically the Old space fills up to 100% and full GCs start taking 20-30s to run so requests start timing out. I call this “falling over”… it does continue to run but suboptimally to say the least.
Transfer’s cache is built on weak references and I have corresponded with Mark about it. I want to hire him to look at it because if it’s a Transfer issue it should be fixed and I’m willing to pay to make that happen. He’s just booked solid and I missed an earlier opportunity to get his help when I was still dorking around with MAT and the code.
When you say you “set the GC interval to 10 minutes”, do you mean a scheduled task with the Java code that triggers a full GC or something else?
Brian said:
on August 25, 2009 at 11:53 pm
Woohoo! I managed to catch up with Mark Mandel tonight and we worked in MAT together via Connect and found the source of the issue. We don’t have a solution yet but we found the exact object holding onto the heap. I’m confident we’ll be able to find a fix next and I’ll post an update then. Turns out you CAN find memory leaks in MAT.
marc esher said:
on August 26, 2009 at 3:36 am
Brian,
when I mentioned increasing frequency, I meant adding something like this to your jvm settings: -Dsun.rmi.dgc.client.gcInterval=600000 -Dsun.rmi.dgc.server.gcInterval=600000
which would cause GC every 10 minutes.
That’s great news that you guys have figured it out. I’d love to see how you used MAT to get to the answer, because like you, I find “getting to the object” to be somewhat dark art, somewhat hunched-over-till-your-neck hurts persistence. If there’s an easier way, I’d love to learn about it.
Brett said:
on August 27, 2009 at 12:49 pm
These are a lot of “fun”, glad you guys have uncovered the culprit. I’m curious to hear what was causing it.
We ran into a memory leak in CF8 about a year ago, it took a while to trace it down but I isolated it in about 50 lines of code.
It does not look like the problem above, our issue was that there were components leaking into sessions which on a high traffic site ate all our memory.
The bad news is the issue still exists in CF8, the good news is it appears fixed in CF9.
If anyone is interested, I posted the code to reproduce it here:
http://drop.io/memleak
You’ll want JMC memleak running when you run the code so you can see the number of instances of a locally scoped CFC persist for the life of the session.
Hope it helps someone – it was a week I don’t want to relive.
Steve 'Cutter' Blades said:
on August 27, 2009 at 2:13 pm
@Brian -
Glad you’ve figured it out. I look forward to seeing how you finally tracked it down, and what it took to fix it.
@Brett -
Interesting link there. I’m especially interested in this statement:
“Components should not be set assigned to sessions from within another component”
I would think that would include Application.cfc, which is where we place many different components into the SESSION scope, within the onSessionStart() method. (Glad to hear it’s resolved in CF9, but I imagine some folks have a more immediate need…)
Brett said:
on September 1, 2009 at 5:48 am
@Steve – I never tested it with Application.cfc but that would be a huge hotspot if it had the same issue.
I just tested the new Cumulative Hot Fix 3 for ColdFusion 8.0.1 and this Issue is finally fixed. I assume this is the fix mentioned for
bug 72641
“Fix for memory leaks with CFCs stored in memory scopes. Note, this does not eliminate need for proper use of VAR scope in CFC methods.”
http://kb2.adobe.com/cps/511/cpsid_51180.html
Brian said:
on September 1, 2009 at 10:10 am
Wow! This is a big update, thanks for posting here Brett! I’m going to apply it tonight. An uUpdate on working with Mark – turns out he had a faulty unit test so we don’t have a culprit yet. We know what’s holding onto the references (reapMap) but not why.
brian said:
on September 9, 2009 at 9:25 am
It’s worth noting that the bug 72641 mentioned above was actually fixed in CHF2, which we had applied previously, and which appeared to do nothing for our particular issue.
Tentatively, we have radically improved our situation by going from 1.6.0 U12 and U14 back to U10. With that change we have been up for over a week without a restart and still have 30% free memory. I don’t think it has solved the issue but we’re making progress and at least I don’t have to babysit the servers ever 48 hours. Mark Mandel can’t reproduce the issue despite having seen it in my heap dump so we’re struggling with how to actually fix.
ubuntubugs: [440985] ld thrashes system while compiling following … | DevBlogr said:
on October 4, 2009 at 2:15 pm
[...] My memory leak in pictures » ghidinelli.com [...]
Chris Peterson said:
on November 11, 2009 at 11:13 am
Brian,
Did you ever work out what in Transfer was keeping that reference, and get a solid resolution to this issue? Just curious what you ended up with!
Chris Peterson
Brian said:
on November 11, 2009 at 4:51 pm
@Chris – I did work out the root cause with Mark Mandel unfortunately there was no resolution. It ultimately wound up in this: http://www.ghidinelli.com/2009/09/21/match-bounty-transfer-cache-improvements which succeeded and the work is currently underway. We should have something to test here in the next few days and then goodbye internal Transfer cache and hello memory stability!
FWIW, moving back from JDK 1.6.0_u14 to u10 made the app last about 3x longer (roughly a week at a go instead of ~2 days). No reason why that should be the case but… that’s where we are today, waiting for Mark to finish the caching update.
Using Transfer’s new EHCache » ghidinelli.com said:
on November 18, 2009 at 9:29 pm
[...] Delete all of your *.transfer files from your generated folder and restart your application. You should see it come back up, just like it always has. The difference? No more leaky SoftReferences! [...]