AIM Sports makes a great set of data acquisition systems for motorsport applications and I use the MyChron 3 in my Spec Miata. To find those last tenths, I share data with other racers and compare how we each take turns to find out which way works the best.
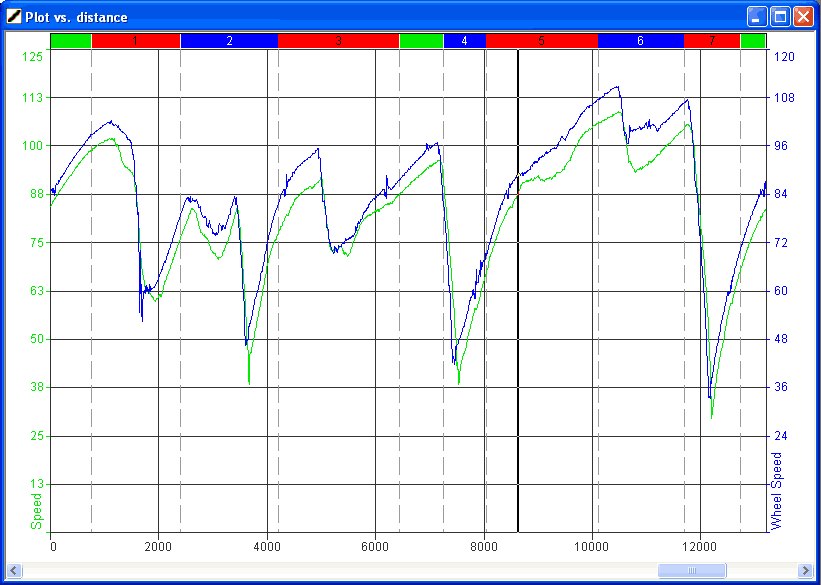 This past weekend at Sears Point (Infineon Raceway), I was comparing data that used a different scale (0-120mph instead of 0-125) causing the graph to be offset above mine. It looked like he was absolutely killing me everywhere, which was discouraging but not entirely surprising as he wins a lot of races. To see the real values, it required scrubbing the data with the mouse which is time consuming and not very visually intuitive.
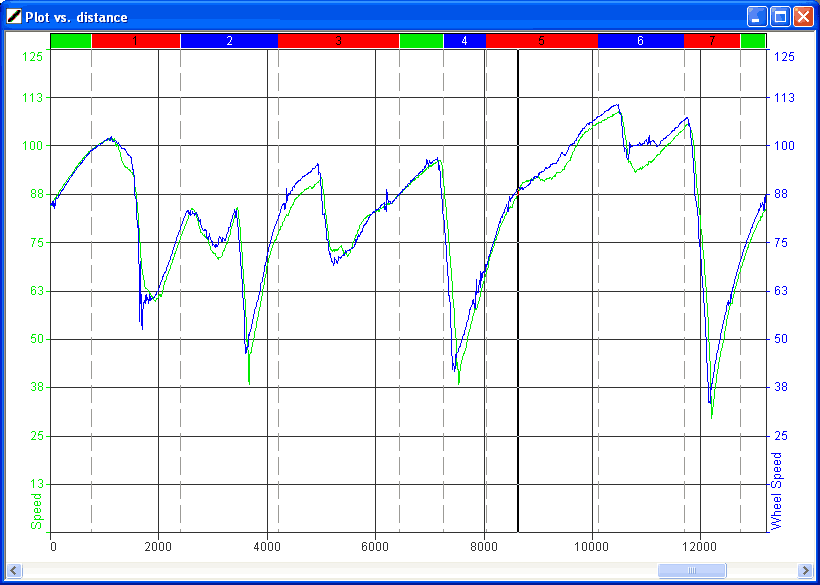 Today I finally figured out how to fix this. The good news is that we’re not that far apart except in a few places. The nomenclature in Race Studio Analysis isn’t exactly great for data newbies. The trick is that the data you’re looking at isn’t the “plot”, but are “Test Channels”. The procedure is:
- Load the test
- Plot the data vs. a value like “Plot vs. Distance”
- Select Modify -> Test Channels (Alt + F8)
- Adjust the scale parameter for the value of interest, in my case “Speed” to be 0-125 which matches my data
Of interest is that his wheel circumference was set to be ever-so-slightly different than mine. Knowing that a fresh set of shaved tires has a tread depth of 4/32″ and we drive them until they’re 1/32″ or 0/32″, that equates to a rough circumference difference of 0.59″. My setting, inherited from the former car owner, is at 72.2201. Looks like that can vary 0.8% which is a non-trivial amount at 100mph. Probably “good enough” for most of us amateurs but I wonder if it’s not worth having a 4/32″, 3/32″, 2/32″, 1/32″ and slick circumference setting for maximum accuracy?
 All Categories from Feedburner
Comments are closed.