ColdFusion MX. Such an improvement in so many ways, yet when it comes to debugging, the addition of the Java Virtual Machine has created nothing but headaches for your average ColdFusion developer. The reason is: we’re not Java developers and the JVM is some scary black box full of voodoo. That’s what my mama told me.
However, when you have performance issues or your server is crashing with Out Of Memory errors, you have no choice but to dig deep into the guts of the server and find the problem. The good news is that, while different from traditional ColdFusion development, the following tools and techniques are easy to use and will help you find what’s killing your application.
Disclaimer: These techniques have been tested on ColdFusion multi-server installations, and thus, ColdFusion Enterprise. It seems like it’s possible with standalone and CF Standard installs but I have not attempted it.
Preparing your Environment
The Sun JDK ships with a wealth of tools, detailed below, that are not available in the Adobe CF distribution so you will need to change your JVM. Don’t worry – it’s incredibly easy and if you’re using CF8 and have not already done this, then you’ll also fix the ClassLoader bug which will be a huge performance boost all on its own. Swapping the JVM requires downloading one file and editing one text file:
- Download the JDK (not JRE) and install it
- Update the java.home parameter in your <coldfusion_root>/bin/jvm.config file according to Adobe intructions or just figure it out, using a value like
java.home=C:/Program Files/Java/jdk1.6.0_10/jre
In addition to running the Sun JDK, you may need to run the following commands as the same user running the ColdFusion process. On our production Linux machines, this is “apache” so I use the “su” command to become that user and execute the commands. On Windows, I run CF from a batch file so I can watch the console output so there is no need to change users. If you run it under the system account, check out Jochem Van Dietem’s post on using JDK tools to analyze hangs where he gives a little tool to execute the JDK commands as the SYSTEM account.
Using JDK tools to inspect your JVM
All of the JDK tools require the process ID of your ColdFusion instance as an argument. Thankfully there is a simple command “jps” that will tell you what’s running. All of the commands below are in the bin folder of the JDK you just installed whether it be Windows or Linux:
$ /usr/java/latest/bin/jps
24986
12219 Jps
We don’t want the Java program running JPS, so obviously our PID is 24986. Now traditionally, the first thing people advocate when troubleshooting the server is to enable JRun metrics. In addition to the JDK tools below, I also use JRun metrics with the following config in my /opt/jrun4/servers/*/cfusion/SERVER-INF/jrun.xml files:
<attribute name="metricsFormat">bsy/tot/lstn/idl/dlay/hndld): {jrpp.busyTh}/{jrpp.totalTh}/{jrpp.listenTh}/{jrpp.idleTh}/{jrpp.delayRq}/{jrpp.handledRq} Sess: {sessions} Total/Free={totalMemory}/{freeMemory}</attribute>Which gives the output like the following:
11:33:40 metrics bsy/tot/lstn/idl/dlay/hndld): 0/21/1/20/0/5 Sess: 114 Total/Free=2037824/1666501
11:33:50 metrics bsy/tot/lstn/idl/dlay/hndld): 1/21/1/19/0/4 Sess: 115 Total/Free=2038720/1719342
11:34:00 metrics bsy/tot/lstn/idl/dlay/hndld): 0/21/2/19/0/10 Sess: 116 Total/Free=2038272/1689867
11:34:10 metrics bsy/tot/lstn/idl/dlay/hndld): 0/21/2/19/0/1 Sess: 117 Total/Free=2038272/1676196
Don’t forget you have to actually enable metrics (metricsEnabled) for it to start recording. Most of the recommended metrics settings out there do not include the jrpp.handledRq which I think is critical to understanding how busy your server is. The number of simultaneous threads is nice to see when the server is backed up, but I also like to see how many requests I processed in the previous 10 seconds for a ballpark TPS.
Getting Memory Usage without JRun Metrics
You can also inspect the JVM without metrics by using jstat and jmap. It doesn’t provide identical information but if you’re looking for memory leaks, JRun metrics are less useful than the JDK tools. Here’s how you can use jstat to see how memory is being used by the JVM:
$ ./jstat -gcutil 24986 5000
  S0    S1       E       O        P        YGC   YGCT       FGC FGCT     GCT
  0.00  99.88  83.26  91.83  83.85   7768  179.485   64   327.455  506.941
  0.00  99.88  90.02  91.83  83.85   7768  179.485   64   327.455  506.941
  0.00  99.88  93.54  91.83  83.85   7768  179.485   64   327.455  506.941
  0.00  99.88  93.66  91.83  83.85   7768  179.485   64   327.455  506.941
 88.68   0.00   8.77  91.83  83.85   7769  179.537    64   327.455  506.992
 88.68   0.00  13.25  91.83  83.85   7769  179.537   64   327.455  506.992
 88.68   0.00  17.07  91.83  83.85   7769  179.537   64   327.455  506.992
 88.68   0.00  20.98  91.83  83.85   7769  179.537   64   327.455  506.992
  0.00  99.93  83.21  91.83  83.85   7770  179.588   64   327.455  507.043
 21.00   0.00  75.62  92.51  83.85   7775  179.919   64   327.455  507.375
  0.00   6.85  57.91  92.76  83.85   7780  180.157    64   327.455  507.613
The 5000 outputs another line every 5000ms otherwise jstat will output a single line and exit. The fields from left to right are:
| S0 | Survivor space 0 utilization as a percentage of the space’s current capacity. |
| S1 | Survivor space 1 utilization as a percentage of the space’s current capacity. |
| E | Eden space utilization as a percentage of the space’s current capacity. |
| O | Old space utilization as a percentage of the space’s current capacity. |
| P | Permanent space utilization as a percentage of the space’s current capacity. |
| YGC | Number of young generation GC events. |
| YGCT | Young generation garbage collection time. |
| FGC | Number of full GC events. |
| FGCT | Full garbage collection time. |
| GCT | Total garbage collection time. |
That’s some pretty interesting data. One thing we’re noticing as we debug a memory issue in our two-node cluster is that the box that runs out of memory first has half as many YGCs as the other. We’re not sure why only one box has this issue but it does indicate that objects are incorrectly making it into Old Generation where they can’t be garbage collected. That might be because there are unreleased references to a shared scope like Session or Application.
There’s more info on jstat at http://java.sun.com/j2se/1.5.0/docs/tooldocs/share/jstat.html.
Stack Traces with Jstack
It can also be helpful to know what the JVM is currently doing (a thread or stack trace). You can get it with jstack:
$ ./jstack 24986
2009-07-09 11:01:10
Full thread dump Java HotSpot(TM) Server VM (14.0-b16 mixed mode):

"pool-1-thread-1063" prio=10 tid=0x1c920800 nid=0x3e8a in Object.wait() [0x1d283000]
   java.lang.Thread.State: TIMED_WAITING (on object monitor)
        at java.lang.Object.wait(Native Method)
        - waiting on <0xa8b9f038> (a edu.emory.mathcs.backport.java.util.concurrent.SynchronousQueue$Node)
        at java.lang.Object.wait(Object.java:443)
        at edu.emory.mathcs.backport.java.util.concurrent.TimeUnit.timedWait(TimeUnit.java:364)
        at edu.emory.mathcs.backport.java.util.concurrent.SynchronousQueue$Node.attempt(SynchronousQueue.java:374)
        at edu.emory.mathcs.backport.java.util.concurrent.SynchronousQueue$Node.waitForPut(SynchronousQueue.java:402)
        - locked <0xa8b9f038> (a edu.emory.mathcs.backport.java.util.concurrent.SynchronousQueue$Node)
        at edu.emory.mathcs.backport.java.util.concurrent.SynchronousQueue.poll(SynchronousQueue.java:566)
        at edu.emory.mathcs.backport.java.util.concurrent.ThreadPoolExecutor.getTask(ThreadPoolExecutor.java:994)
        at edu.emory.mathcs.backport.java.util.concurrent.ThreadPoolExecutor.runWorker(ThreadPoolExecutor.java:1054)
        at edu.emory.mathcs.backport.java.util.concurrent.ThreadPoolExecutor$Worker.run(ThreadPoolExecutor.java:575)
        at java.lang.Thread.run(Thread.java:619)

"pool-1-thread-1062" prio=10 tid=0x0aaf5400 nid=0x3d1d in Object.wait() [0x25218000]
   java.lang.Thread.State: TIMED_WAITING (on object monitor)
        at java.lang.Object.wait(Native Method)
        - waiting on <0xad68e528> (a edu.emory.mathcs.backport.java.util.concurrent.SynchronousQueue$Node)
        at java.lang.Object.wait(Object.java:443)
        at edu.emory.mathcs.backport.java.util.concurrent.TimeUnit.timedWait(TimeUnit.java:364)
        at edu.emory.mathcs.backport.java.util.concurrent.SynchronousQueue$Node.attempt(SynchronousQueue.java:374)
        at edu.emory.mathcs.backport.java.util.concd(BufferedInputStream.java:317)
        - locked <0x9c870f00> (a jrun.servlet.io.ReusableBufferedInputStream)
        at jrun.servlet.jrpp.ProxyEndpoint.reaet.SocketInputStream.socketRead0(Native Method)

(...and about 1,000 more lines after this...)
The stack trace is helpful not only in debugging memory leaks but also unresponsive servers because you can see deadlocks or other long running processes by running a series of thread traces and comparing them. Common thread states in the dump include the following:
- NEW A Fresh thread that has not yet started to execute.
- RUNNABLE A thread that is executing in the Java virtual machine.
- BLOCKED A thread that is blocked waiting for a monitor lock.
- WAITING A thread that is wating to be notified by another thread.
- TIMED_WAITING A thread that is wating to be notified by another thread for a specific amount of time.
- TERMINATED A thread whos run method has ended.
Adobe also has KB article 18339 on understanding thread dumps which has more detail as well as how to tie back the stack trace to your ColdFusion code. One challenge I have experienced is that in a front-controller framework like Model-Glue, Coldbox or Mach-II, every request is /index.cfm which makes debugging more difficult.
You can get more info about jstack at http://java.sun.com/j2se/1.5.0/docs/tooldocs/share/jstack.html.
Memory Consumption in the Heap
Before you generate a full heap dump, you might just want to see some details about the memory usage first. This is similar to what jstat provides but is easier to read:
$ /usr/java/latest/bin/jmap -heap 24986
Attaching to process ID 24986, please wait...
Debugger attached successfully.
Server compiler detected.
JVM version is 14.0-b16

using thread-local object allocation.
Parallel GC with 4 thread(s)

Heap Configuration:
   MinHeapFreeRatio = 40
   MaxHeapFreeRatio = 70
   MaxHeapSize      = 2097152000 (2000.0MB)
   NewSize          = 1048576 (1.0MB)
   MaxNewSize       = 4294901760 (4095.9375MB)
   OldSize          = 4194304 (4.0MB)
   NewRatio         = 8
   SurvivorRatio    = 8
   PermSize         = 134217728 (128.0MB)
   MaxPermSize      = 201326592 (192.0MB)

Heap Usage:
PS Young Generation
Eden Space:
   capacity = 205455360 (195.9375MB)
   used     = 145981424 (139.21873474121094MB)
   free     = 59473936 (56.71876525878906MB)
   71.05262379136762% used
From Space:
   capacity = 13762560 (13.125MB)
   used     = 10907728 (10.402420043945312MB)
   free     = 2854832 (2.7225799560546875MB)
   79.25653366815476% used
To Space:
   capacity = 13762560 (13.125MB)
   used     = 0 (0.0MB)
   free     = 13762560 (13.125MB)
   0.0% used
PS Old Generation
   capacity = 1864171520 (1777.8125MB)
   used     = 1828003480 (1743.319969177246MB)
   free     = 36168040 (34.492530822753906MB)
   98.05983303510612% used
PS Perm Generation
   capacity = 134217728 (128.0MB)
   used     = 112527152 (107.31425476074219MB)
   free     = 21690576 (20.685745239257812MB)
   83.83926153182983% used
I’ll talk more about the JVM arguments, but in your jvm.config, you can pass -Xmn (minimum), -Xms (initial) and -Xmx (maximum) heap size arguments to ColdFusion on startup. If Xmn and Xmx are not the same value, then your heap will be whatever size the JVM needs between those two numbers, starting at the Xms value if provided, or Xmn value if not. “The heap” is subdivided into several components used during the lifecycle of the JVM. Here’s a quick breakdown:

The heap is divided into two general areas: Young and Old. The Young generation area is sub-divided further into Eden and two survivor spaces.

Eden is the area where new objects are allocated. When garbage collection occurs, live objects in Eden are copied into the next survivor space. Objects are copied between survivor spaces in this way until they exceed a maximum threshold, and then they are moved out of the Young area and into the Old1. Objects which are stored in ColdFusion shared memory scopes like Session and Application usually go to Old Generation.
There’s a great slide deck on JVM memory management by Filip Hanik from Covalent that you should check out if you want more details. The above two images are from his presentation.
Generating a Heap Dump
Why do you want a heap dump? Because you can inspect it and see exactly what classes and objects are hanging around in your JVM. The heap dump is a static copy of the JVM heap at the moment you run the command. It’s easy to generate on demand:
$ /usr/java/latest/bin/jmap -dump:format=b,file=/tmp/web.hprof 24986
Dumping heap to /tmp/web.hprof ...
Heap dump file created
$ ls -al /tmp/web.hprof
-rw------- 1 apache apache 2161658208 Jul  9 10:37 /tmp/web.hprof
$ gzip /tmp/web.hprof
$ ls -al /tmp/web.hprof.gz
-rw------- 1 apache apache 637434414 Jul  9 10:37 /tmp/web.hprof.gz
In this example, the heap is as big as the memory I allocated to the JVM (-Xmn=2000, -Xmx=2000) but compressed it is only 637MB. That’s more friendly to download so you can inspect it on your desktop.
You can also generate a heap dump when your JVM runs out of memory automatically by specifying an additional argument to the JVM. In your jvm.config file (found under <coldfusion_root>/bin), you can add the following to your java.args parameter to trigger a dump whenever the JVM throws a java.lang.OutOfMemoryError:
-XX:+HeapDumpOnOutOfMemoryErrorThe advantage to this approach is that a big heap dump is typically more valuable than a small one because any memory leaks that consume the heap will often be the largest objects. The bigger they are, the easier they are to spot and more information you have to analyze.
There’s more information about heap dumps at http://blogs.sun.com/alanb/entry/heap_dumps_are_back_with. Also check out this post with 10 useful memory analyzer tips – be sure to read the comments too.
Analyzing the Heap Dump
The heap dump is a bit fat binary file that is pretty much useless without a tool to profile it. Enter the Eclipse Memory Analysis Tool. Download this package to your desktop and extract it. Download the heap dump you generated above and uncompress it.
Depending on the size of your heap dump, you may need to bump up the JVM arguments for MAT. For one of my large dumps, I had to modify <mat directory>/MemoryAnalyzer.ini to include -Xmx1600m. You can try firing up MAT first; if you run out of memory while crunching the heap you know what to change.
Once you have MAT open, you want to open your heap (.hprof file, or whatever you named it). It’s going to run some calculations for you which could take tens of minutes depending on the size of your heap and the power of your computer.
By default, MAT likes to show you the memory leak suspects report. For Java developers this is probably really useful but for ColdFusion people, the biggest items in the heap are ColdFusion core components. You’ll need to drill down a bit into the Dominator Tree and use the filtering for cf* classes. Here are a few good posts on using MAT:
- SAP Memory Analyzer Tutorial – This was what the MAT was before it was an Eclipse project but a lot of the explanations still apply as to what each feature does.
- Eclipse Wiki – Finding Memory Leaks
- Screenshots plus mention of Jrockit – more on Jrockit in a moment
I’m still learning how to really dig into MAT and find issues – it’s a powerful tool!
Monitoring the JVM in real time
In addition to analyzing the static heap dump, you can also watch the JVM in real time as you access your application to see how many instances of objects exist in your heap at any moment. This is an extremely powerful way to micro-analyze which actions are leaking memory. I used this approach with unit tests to find an instance where the trunk version of Transfer ORM was not properly releasing objects and causing a memory leak. In my case, rolling back to the last public release of 1.1 solved that issue.
This approach is an updated version of Mike Schierberl’s ColdFusion Memory Leaks – Profiler Introduction that he posted in 2006. I never looked into these approaches because I was intimidated by the JVM and its lingo but the below steps can have you up and monitoring in 10 minutes – there is no reason not to try them!
The first thing is to download JRockit Mission Control from Oracle (previously BEA). If you’re running ColdFusion 8, you’ll want to get the Java 6 version. If you are on ColdFusion 7, I believe you need Java 1.4 but I have not tried this on CF7. I installed mine, on my Windows laptop, to c:/program files/java/jrmc-3.1.0-1.6.0/
Now we need to tell ColdFusion to use the Jrockit JVM which is accomplished by editing the jvm.config file. On windows, the common location is c:\jrun4\bin\jvm.config. There are two lines you will need to modify. First, update the java.home parameter to point at your new JRockit JVM, just like we did originally with the Sun JVM:
java.home=c:/program files/java/jrmc-3.1.0-1.6.0/jreSecond, add the following on to the end of your java.args parameter to enable monitoring by Mission Control. Note that this opens up the port to the world so if you’re trying this on a public network or in production, you need to appropriately firewall port 9010:
# append onto the end of the java.args line:
-Xmanagement:ssl=false,authenticate=false -Djrockit.managementserver.port=9010
Ok, you’re ready to go. Start up ColdFusion. Look in the console window – if you have modified your JVM arguments it is possible that you will have passed something that JRockit does not like and it could prevent ColdFusion from starting. For the record, this is what I use in its entirety on my Windows laptop:
# jrockit
java.home=c:/program files/java/jrmc-3.1.0-1.6.0/jre
java.args=-server -Xmx512m -Dsun.io.useCanonCaches=false -Dcoldfusion.rootDir={application.home}/ -Xmanagement:ssl=false,authenticate=false -Djrockit.managementserver.port=9010
With ColdFusion running, start up the Jrockit Mission Control application. In the left pane, you will see one or more JVMs running on your machine. If you have more than one, you need to guess at which to monitor. Don’t worry, if you get it wrong, just select the other. Right-click on the JVM instance and choose “Start Memleak”.

By default, Jrockit only lists classes that take up at least a certain amount of the heap. To see your average ColdFusion class, you’ll need to turn this off. Thanks to Steven Erat for reminding me to include this; the setting is under Preferences -> Jrockit Mission Control -> Memory Leak Detector -> Trend. Set the lowest heap usage to 0 as in this screen shot:

This will bring up window of all of the instantiated classes in the JVM. There is a lot of stuff in the JVM that is core ColdFusion stuff though, so you’ll want to use the filter at the bottom to limit it to just ColdFusion stuff (unless you’re looking for something else).
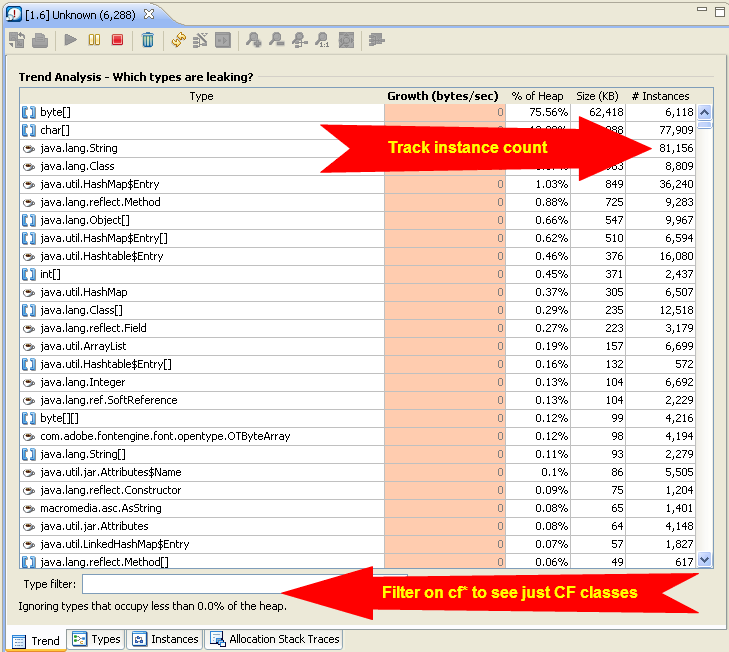
You can do that by entering “cf*” into the filter field. In my case, I wanted to see all of my Service layer objects – they are files named like UserService, AuthenticationService so I filtered to “cf*Service*”. Experiment here with trying to find what you’re after.

I mentioned above that I used this technique to find that Transfer was leaking objects and there was one object in particular that seemed to be filling up the heap – formbean.cfc. I created a unit test that caused a hierarchy of formbeans to be loaded and then monitored Mission Control while the unit test ran. As the test was running, I could see the instances ratchet up to about 50 (the expected number); here is a screenshot part way through the process:
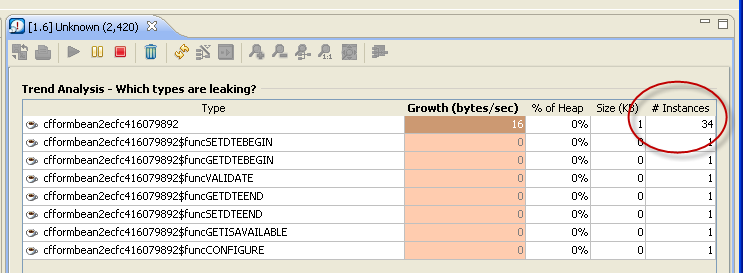
After the unit test finished, Mission Control was showing 10 instances of cfformbean2ecfc416079892 when they should have been garbage collected and removed.
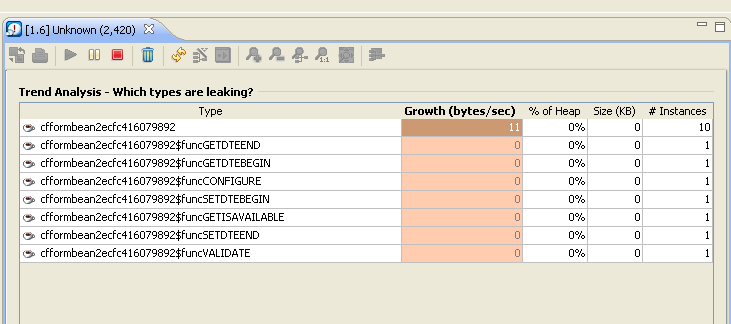
I tried rolling back to Transfer 1.1 and ran the test again. Initially it looked the same – instances climbed up to about 50 and then started falling at the end of the test. Here’s what I wound up with:

All instances were properly reaped leaving no objects behind. Only a single instance of each class method is retained (which I believe simply means that CF has compiled the class once). This confirmed that the leak behavior was no longer present so we pushed it to production. Unfortunately we seem to have another leak elsewhere but it has improved the time between restarts.
!EOF
That’s all I have for this post – I have another post in the works that will break down the components of the JVM memory to better understand what each of the various heap spaces do and how they all fit together. I learned a lot from a handful of experts like Mike Brunt, Abraham Lloyd, Elliot Sprehn and Daryl Banttari among others that I will summarize here. In the mean time, I hope this helps you solve a performance problem!
1 – Description of Old/Young gen comes from http://edocs.bea.com/wls/docs61/perform/JVMTuning.html#1116319 under “About Generational Garbage Collection”
 All Categories from Feedburner
Bim said:
on July 16, 2009 at 2:26 pm
Thanks! Lots of info to pore through. We’ve definitely had our share of JVM memory performance issues. We’ve used SeeFusion to see how our JVM resources look but this looks definitely more in-depth.
Mike Schierberl said:
on July 16, 2009 at 2:49 pm
Excellent post Brian, definitely goes in my bookmark list. Looking forward to the followup.
Steven Erat said:
on July 16, 2009 at 6:52 pm
Look forward to reading this, as mentioned by @mikeschierberl today. I recently setup JProbe’s trial edition and found filtering on cf didn’t produce anything interesting. I set up JRocket MissionControl and was able to filter on cf and see results. I’ll be sure to review this article before I attempt to use it again. Thanks
Steven Erat said:
on July 17, 2009 at 10:23 am
Still going thru this and testing all the techniques. I learned that jstat and jmap are already available on Mac OS X, but they are the Apple implementations so for example jmap behaves differently such that it did not have the -dump switch
steven-erats-macbook-pro:~ stevenerat$ jmap -dump:format=b,file=/tmp/cf9.hprof 3432
Usage: jmap [option]
(to connect to a live java process)
On CentOS 5.3 Linux I installed the Sun 1.6.0_14 to get the utilities, then found that jmap didn’t work.
[steven@maccent ~]$ jmap -heap 31762
Attaching to process ID 31762, please wait…
sun.jvm.hotspot.debugger.NoSuchSymbolException: Could not find symbol “heapOopSize”
I remembered that the -XX:+UseParallelGC argument will not work with java debugging, so I changed it to -XX:+UseParNewGC and then it worked.
Steven Erat said:
on July 17, 2009 at 11:07 am
Brian,
So I’ve got JRockit Mission Control running (jrmc) and it successfully attaches to ColdFusion (using CF9 but previously also did CF8). When I start MemLeak on the CF9 process id I see the view with all the Java objects. However, when I add a filter for “cf.*” the table clears and no data is shown. I noticed there’s a little warning at the bottom that says “ignoring objects that take less than 0.1% heap so I wonder if that could be why I don’t see cf objects. I’ve run some small demo apps and loaded the CF Admin, but nothing. Any ideas? Thanks!
brian said:
on July 17, 2009 at 11:23 am
@Steven – thanks for the headsup about the GC flag. I didn’t have that happen to me since my GC flags were different (although I too, ran u14 on CentOS 5.3).
On JRMC, there is an option somewhere that says to not limit small items in the heap; under preferences but I *thought* it was disabled by default. Go to Preferences -> Jrockit Mission Control -> Memory Leak Detector -> Trend and set the lowest heap usage to 0.
Also, a small side note, I don’t think regexps work so make sure it’s cf* not cf.*
Steven Erat said:
on July 17, 2009 at 11:38 am
Thanks for the quick feedback Brian. I set the Trend preference to 0 but still don’t see cf objects with filter “cf*”. I do however see lots jrun objects. I’ll try running a larger app like blogcfc to see if that makes a difference.
I ran the Eclipse MAT on a CF9 heap dump. Wow, there’s an incredible abundance of information there. Love the table of contents view better than the Overview view. Will need to spend some time there just to understand how to best interpret the results.
charlie arehart said:
on July 26, 2009 at 6:17 pm
Great stuff here, Brian, of course. Thanks for organizing and sharing it.
Would you be at all interested in offering a informal presentation on the topic, where you basically just walk through this stuff live, on the Online CF Meetup? Since it’s recorded, I’m sure it would be very popular. You don’t need to “put together a presentation”. You could literally just walk through he process you describe here, live. If you’re at all interested, just let me know.
Same goes for anyone else reading this entry who may want to, either if Brian doesn’t, or if you have some other twist.
For instance, I’m sure some would love to hear about doing this in any form possible while still on CF 7, which of course is Java 1.4, which lacks so many tools, though it does have at least some. If anyone has shown folks how to to tackle memory leaks (other than the obvious file upload one fixed in in CF8 or available as a hotfix), I’m sure there would be an audience for that, too.
Brian said:
on July 27, 2009 at 11:57 am
@Charlie – sure thing; I’m really busy for the next couple of weeks but ping me mid-August and let’s set a date. I probably can’t cover the CF7 stuff unfortunately; I don’t really touch it any longer and don’t have the time to invest in figuring out what works and what doesn’t.
charlie arehart said:
on July 27, 2009 at 12:57 pm
Great to hear (and no worries about covering CF7 stuff: those last two paragraphs were addressed to “anyone else” who may want to pick up that baton. I’ll ping you in mid-august. Thanks.
Michael Horne said:
on January 20, 2010 at 3:06 am
Wow.
Fantastic post. I’d seen the Jrock stuff before, but badly explained. Will give this a go – I have a 2gb 64-bit instance that keeps running out of memory!
Michael Horne said:
on January 22, 2010 at 5:42 am
Well, Brian, what can I say? After using the methods above, I’ve learnt a lot about the JVMs and identified some memory leaks in our code. This was sufficient to allow the process to run that was giving me major headaches.
I might even use the JRockit JVM in production as it seems to be a bit zippier than the standard one.
I found I could monitor the JVM remotely using the Mission Control plugin for Eclipse (which I installed in CF Builder).
I did find when I installled JRockit Mission Control v3.1.2 for Java 5 on our 64-bit platform that I had to copy the amd64 folder in jre\lib to i386 in the same folder. Otherwise, no valid JVM can be found. This is probably just a bad combination of circumstance tho!
Thanks again for this brilliant post
–
Mike Horne
Brian said:
on January 22, 2010 at 7:31 am
@Michael – glad it helped! It was A great learning experience and ultimately helped prove that softreferences under java in Tranfer ORM weren’t freeing up memory like they should. That led to a sponsored open source development project for Mark and now Transfer has a pluggable cache architecture which has solved our memory leak issues. It is frustrating that it took so long to diagnose and solve but still better than rewriting the site or buying lots of new servers. Good luck!